Verifying identities with confidence
Customer 360
This project was motivated by leadership’s desire to incorporate AI/ML as an additional investigative tool used by agents to identify cases of identity fraud.
A combined effort with the data science and graph team would allow ourselves to connect different pieces of personal data and it’s relationship to the individual in question.
This project was given the name “Customer 360”, in essence, providing a 360 view of a customer.
Problem
We only verified information based directly on the end-user’s provided ID documents, selfie, and other biometric data. However, these data points were siloed within a single identity verification transaction.
Our goal for Customer 360 is to provide a holistic view of the end-user's identity by connecting related items, potentially including data shared by other customers. Additionally, we aim to offer upfront risk insights for quicker, confident investigator decisions.
High-Level Goals
The scope of this project was to:
incorporate easily digestible insights gathered from the AI/ML team within a transaction or case.
display an end-user’s PII (personal identifiable information) within a transaction or case.
provide a means to access and display an interface for displaying this information that would allow investigative agents to quickly view the relationships between varying pieces of data and the individual question.
First Iteration Designs
As we had a general idea of where we would like to place the insights and graph we started with rough mockups in Figma to start off discussions with Product and Engineering.
Customer Insights Card
It was decided to display insights gathered from the data science team’s work within the transaction and/or case details pages. With the structure of the page, there was available real estate to place it on the right side of the page.
The information was also deemed to be important enough to be displayed “above the fold”. We were able to apply existing design system components and frameworks used elsewhere in the portal to reduce the effort for engineering to develop these items.
PII Data
It was later brought to my attention to expand the scope of this feature to include displaying the PII of the user in the transaction. Therefore, we were able to add that in and display it as the default view.
Its value lied in the ability to compare the information provided by the customer and their credentials in the documents they provide.
Graph
One of the main features of this project is to provide a graphical view of all data centered around the end-user. This is to provide a quick and digestible way of understanding a user’s network and it’s changes.
The graph design was yet to be decided as the graph team were still working through an assessment of which graphical engine they wanted to use. However, it was assumed we would go with a nodal view and went with that.
User Research Insights & Iterations
We created Figma prototypes and scripts to conduct guided user testing to test with internal stakeholders.
We were able to find that the majority of participants found the value of the insights and PII panel. However, due to many uncertain variables for the graph it was still unclear as to it’s value.
We were able to gather additional actionable insights:
Unclear Source for PII Data
The source of the personal information within the PII panel, derived from the end-user's onboarding inputs (such as the sign-up form or other methods), was not initially evident. This aspect held significance, as its value lay in the comparison between the details furnished by the end-user and the information present in their identification documents.
As a result, we added a note to be explicit about where the data was coming from at the bottom of the card. It was also suggested to include more information beyond their PII to get a better sense of the individual’s presence in their platform, such as past cases, first seen, last seen, and number of verifications.
Insight Cognitive Overload
Testers found that the number of insights being presented may actually introduce inefficiencies in a case worker’s investigation. The amount of information provided overwhelmed them when providing all insights that were available for the person in question.
Therefore, we opted to do away with categories and breakdown insights by high risk vs other insights. “Other” insights being collapsed by default. This was done in the hopes that investigators would be made of aware of what may actually be relevant for the case.
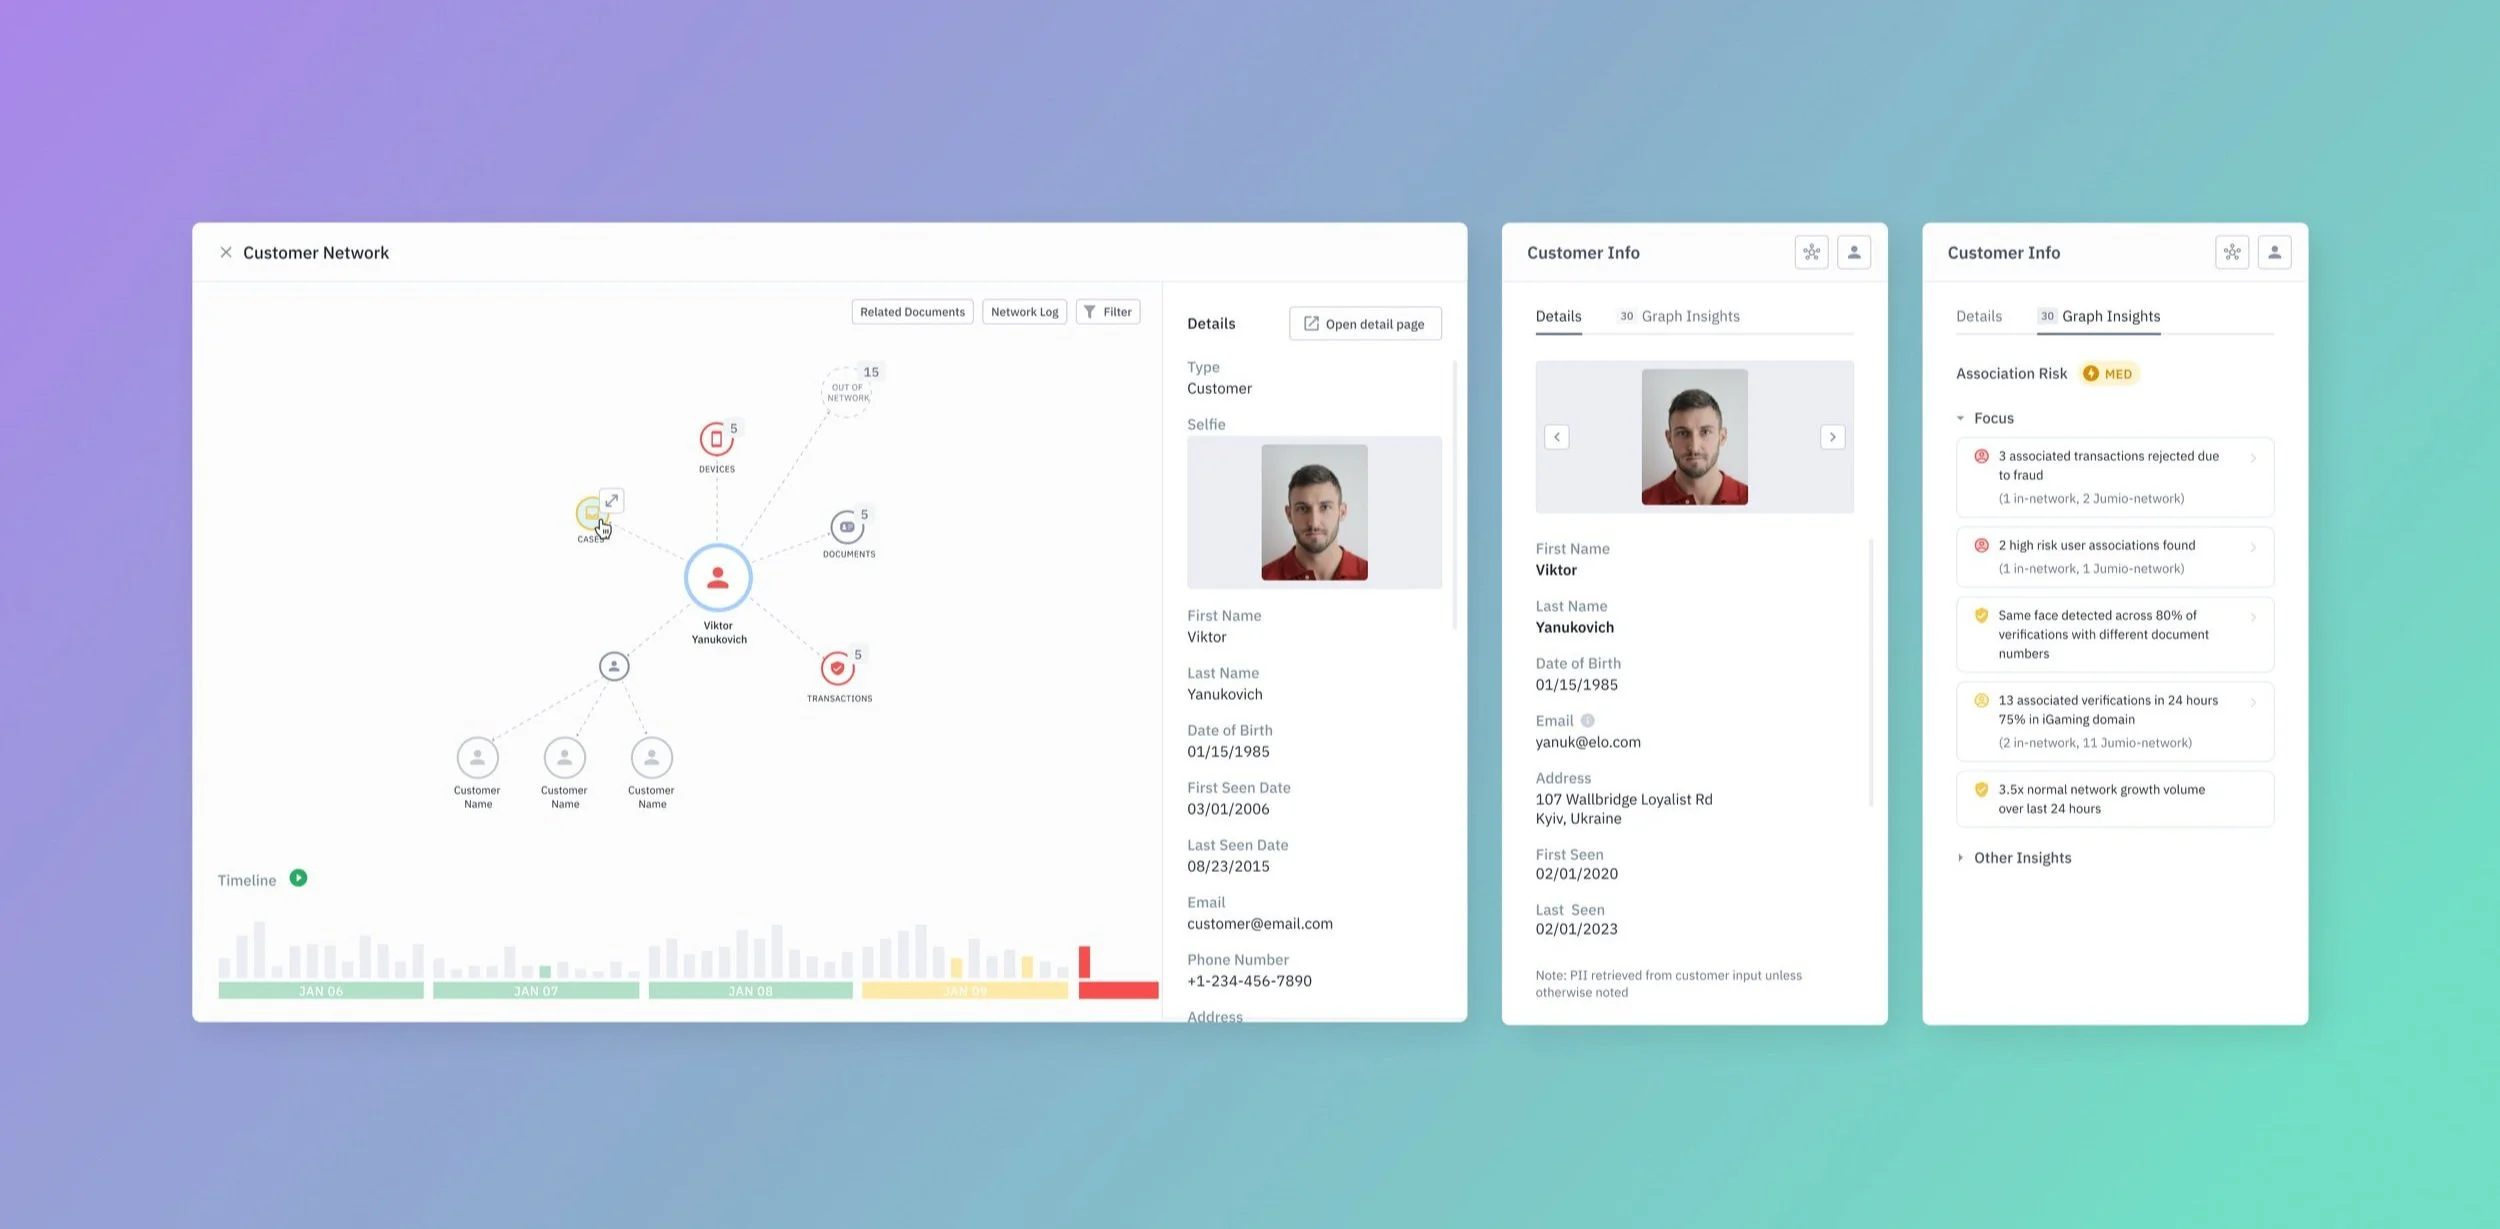
Latest Iteration
We continued to make iterations after many discussions with my Design Partner and Product. We landed on the following iteration before having to hand it over to development with the intention of having a demo ready for the Money 20/20 conference.
Outcome
This was an exciting project as it was a big endeavor for the company to provide AI/ML insights on potential identity fraud. This would help investigation as well as automation in ID checks.
However, this project posed a few difficulties with shifting priorities and changing roadmaps have delayed the launch of this feature. Still, I learned some important takeaways from this project related to product and business processes.
How to adapt to changing requirements
New timelines, resourcing issues, and re-prioritization meant the scope of the project was constantly changing. I had to adapt to those changes and still deliver the best design in time with tight deadlines.
Always fight for good UX
It also took back and forth in discussing the true value of certain aspects of the project, particularly the graph within a transaction/case. Although we may not have come to a solid agreement, it was important to share those concerns so that we all can accept it and move on.
Choosing what we won’t do
Considering the scope of the project as well as deadline to have a working demo in time for the Money 20/20 conference, it was important to discuss with Product what would serve best for the demo as opposed to developing a feature rich product.